Science in the Bookshops of Chiang Mai
I spent the weekend before last in Chiang Mai and while I was there I wandered into a small used bookshop that caters to backpackers and tourists. Browsing through the shelves and spotting familiar authors and titles that I haven't had time for in the past several years proved about as soothing and relaxing as a Thai massage. It also reminded me of ethnography, another main interest of mine that I don't give as much attention as I wish I might. So on a whim I decided to engage in a small ethnographic exercise and combine travel, books, ethnography, and data collection.
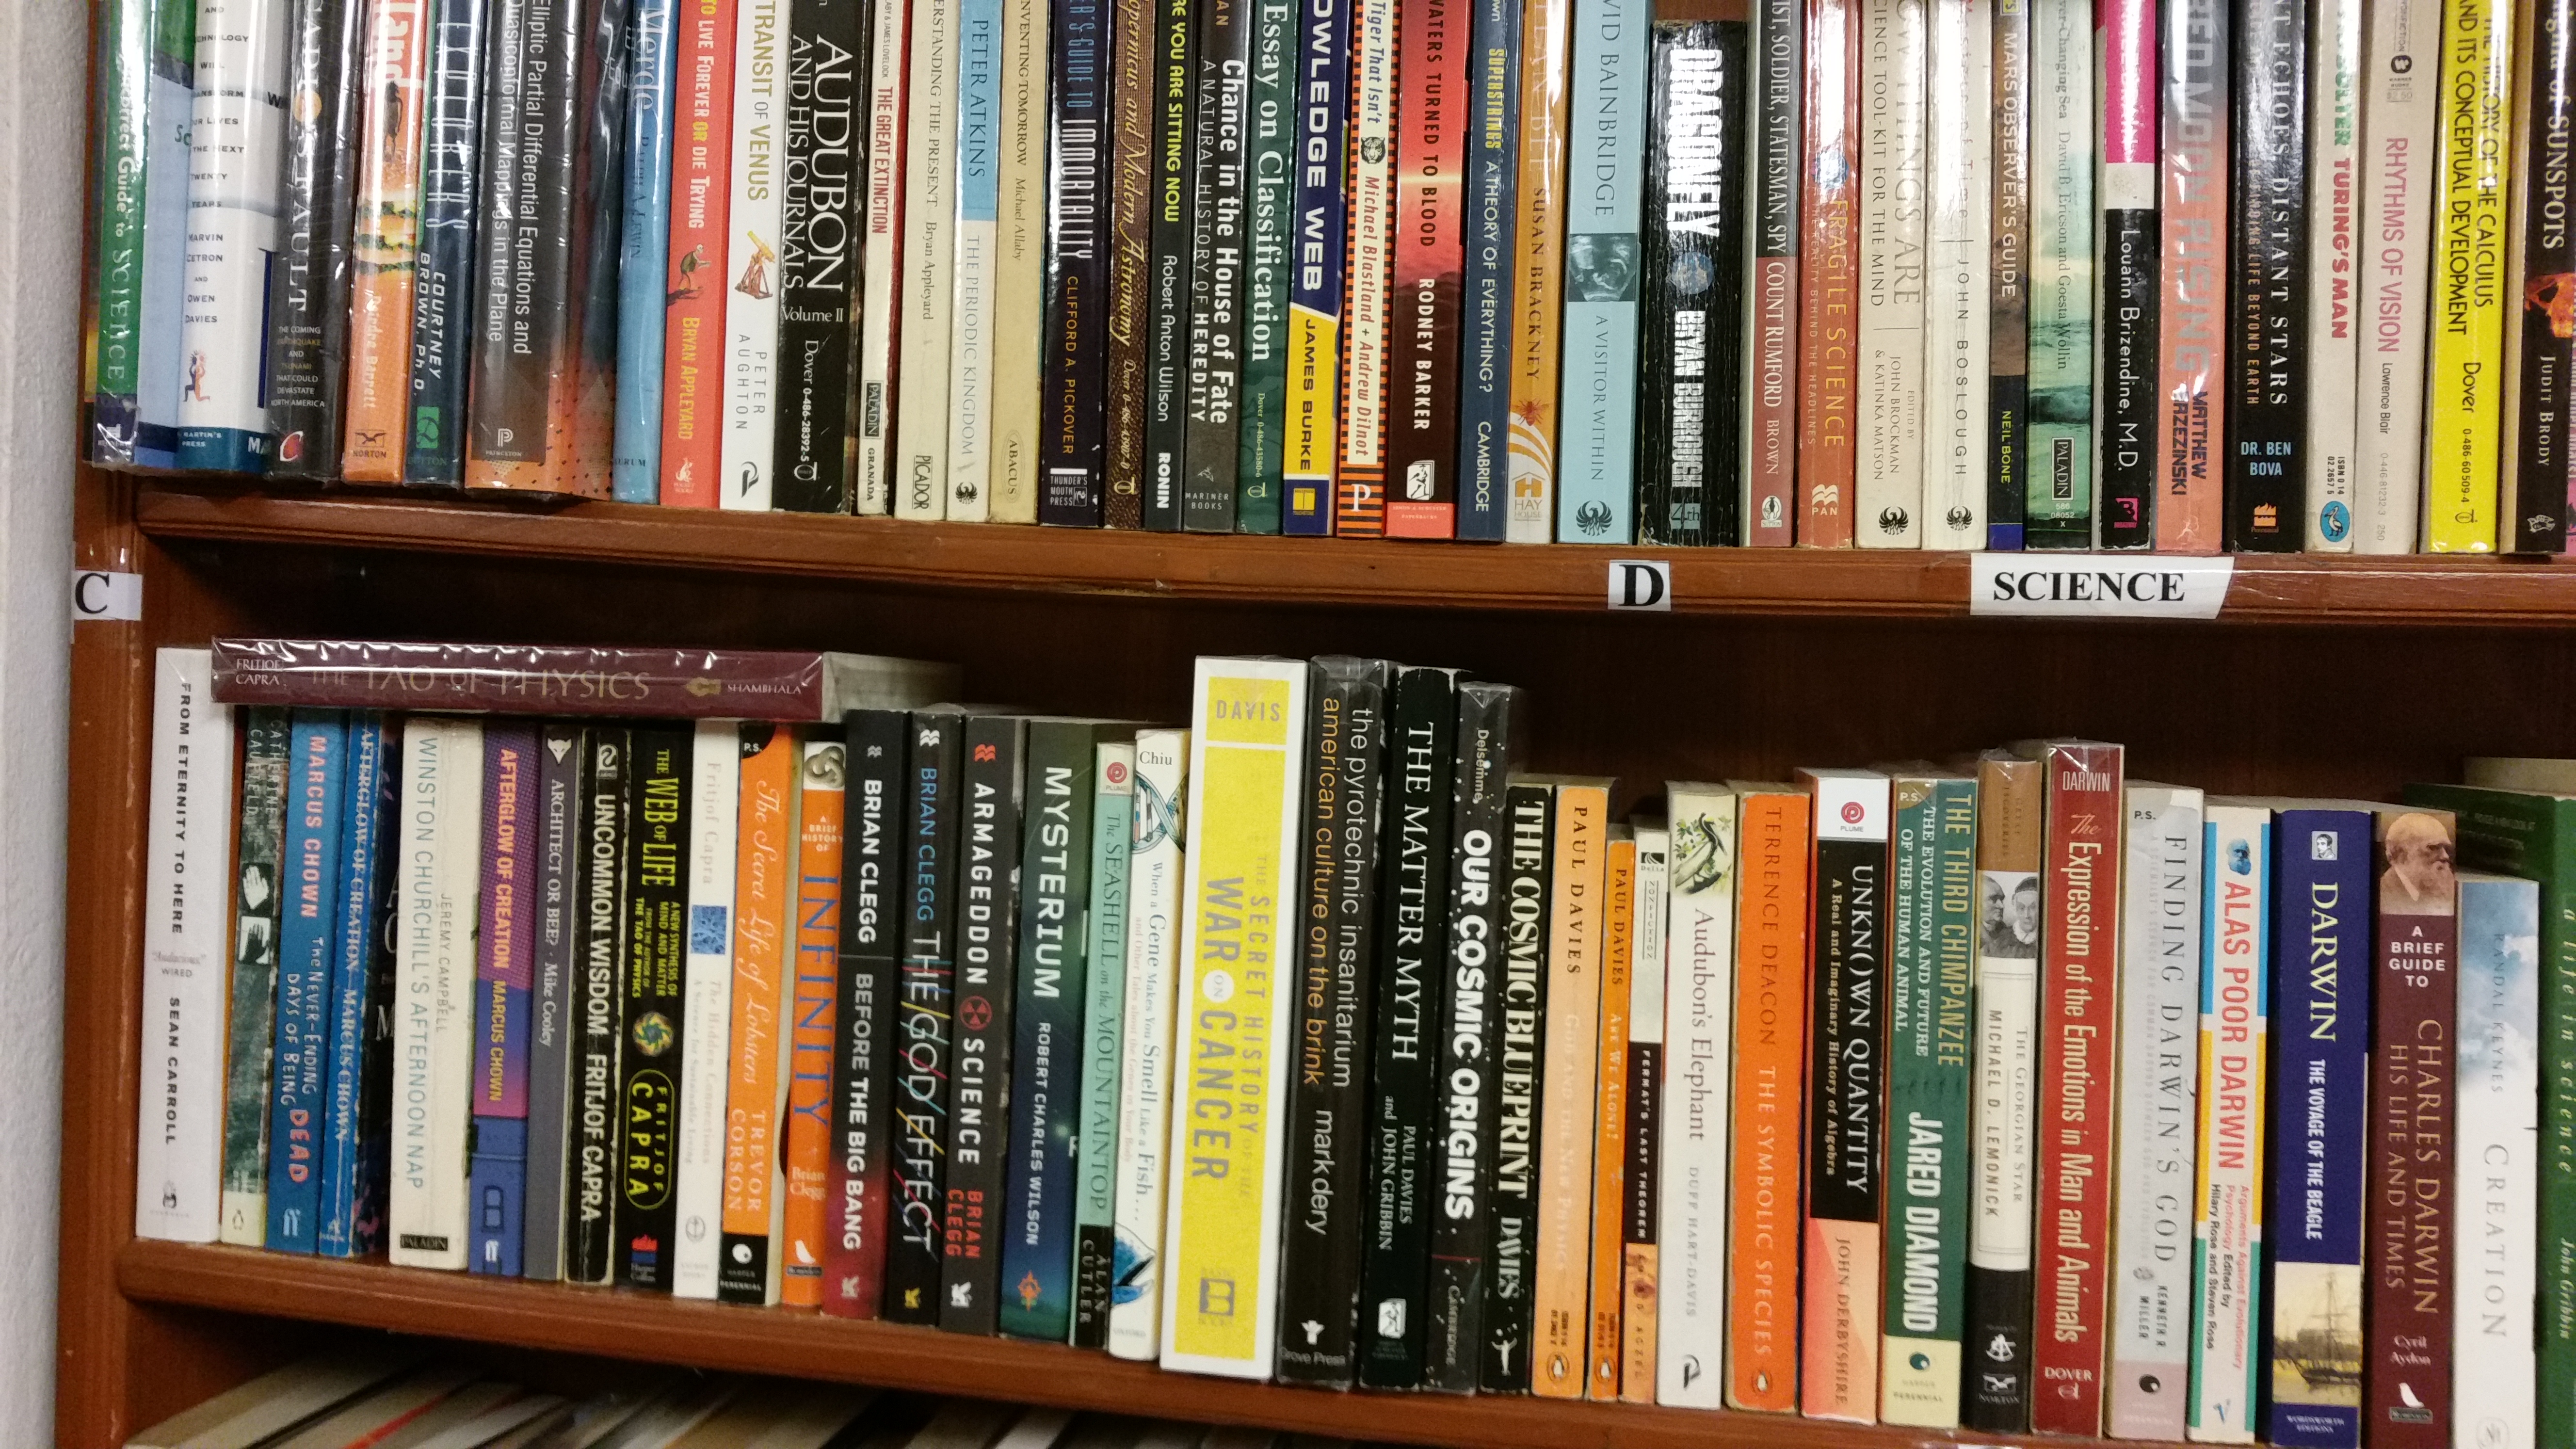
Taking a look at the shelves marked 'science', I decided to systematically describe the science books that show up in the used bookshops of Chiang Mai. To do that I needed to collect data. The data science that interests me the most starts with the collection of in situ data, not with a ready-made and cleaned dataset divorced from its context. If the data's original context is not already digitized (online or mobile), then that's even more interesting. I want to know more about the parts of peoples' lives that aren't spent on their phone or computer. That's what ethnography is really good at describing, and data collection is a critical part of ethnography. In the early days of anthropology a big part of ethnographic training had to do with the use of notebooks, tape recorders and other means for systematically recording observations of daily life and other social phenomena.
Recording each book on the shelf in a notebook would have been the most reliable way of ensuring my sample was accurate and complete, but it wouldn't have scaled well. So I snapped a few pictures of the science bookshelf with my smart phone. Since this was all on the prompting of an idea that had come to me about two minutes before and since taking a picture of a bookshelf seemed entirely unobjectionable, I have to admit I failed to get the informed consent of the bookstore owner. Of course this probably wouldn't have been ok with an IRB anyway, and it turned out that it wasn't ok with the owner either. However, the owner let me take the pictures after I agreed to buy a book (though I'm not sure an IRB would have looked on that as an acceptable way of gaining consent either). During the rest of my trip I managed to visit three different bookshops and photograph their science shelves.
Data collection has the additional upside of forcing you to think about the limitations of your dataset. I know I wasn't able to visit every used bookstore in Chiang Mai; I saw at least four others that I couldn't visit. This site lists about 14 bookstores, and there are almost certainly more. So clearly the dataset that I developed is only a small sample of the total population, and there's no reason to think it is a representative one.
Chiang Mai is the perfect size and layout for tackling something like this; the kind of place just asking for an ethnography. The old city and the areas immediately surrounding it are a pleasantly sleepy and relaxed contrast to Bangkok. About ten-square blocks, the old city is still partially walled and surrounded by a moat. Besides locals the most noticeable population is backpackers and trekker-type tourists. It's an amazingly beautiful place, but I'll balance my fervor with a description written by Thailand railway policymakers in the mid-20th century, which somehow manages to comprehensively recommend the place while making you just a little less convinced you need to see it:
"the scenery was beautiful, many important sites existed, there were a variety of delightful ancient traditions, the population was polite and mild-mannered, all of which made the place appropriate for tourists to visit."
Data and Methods
At home I recorded the titles in the photos in a spreadsheet. There was no way around doing this part manually. Coming to grips with that actually felt good. Automation and algorithms so much dominate my normal work (write code so that the computer does as much of the work as possible, and write it so that you can use it again later), that it's nice to let go and just do something manually. Here again the process of data collection and creation reminds you how messy and incomplete data usually is. Some of the titles were too small or too blurry for me to identify. Out of a total of 416 books that I could identify in the photos, I was able to identify the titles for 342.
As nice as manual work can be occasionally, automation is usually preferable and it's what makes description at scale possible. Using selenium I populated an amazon search for each title and made a first pass at identifying the correct book. It wasn't perfect, but it worked satisfactorily for most of the books and saved a lot of time in comparison to looking each book up individually. I quickly worked through the titles that weren't found (about 30) and managed to find them all manually. Once I had the real titles and links, I wrote a crawler to capture some additional information, mainly the year of publication and the author (I captured some other information, but then decided not to use it).
The graphs below show when the books were published, the top fifty words in the set of book titles, and a text co-occurrence matrix in the form of a small graph. Search/select a word and the graph will display all the other words that co-occurred in the book titles.
I like that 'search' and 'life' are the top two terms after 'science'. It seems fitting.
Since we're on the topic of science and tourism, I have to share this awesome commercial the Thailand Tourism Authority produced way back around 2001. It's way ahead of its time. Apparently they had realized already that data science-enabled robots would one day take all our jobs, and once they did the robots would be the ones enjoying places like Chiang Mai as tourists.
If you want to comment on this post, write it up somewhere public and let us know - we'll join in. If you have a question, please email the author at meinshap@gmail.com.